amuck-landowner

Apache causing huge load, how to pin down the reason?

Greg

New Member
Well I'm new to this, just setup a VPS, threw bunch of sites on it and now i'm overloading it. And they are not that high traffic ones.

Here are some graphs to show my case
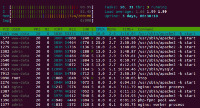
g9s3t8mi.png

here are some vrom VestaCP (standard vestacp automated install)

jwezjd5o.png

Obviosly apache is way overloaded and nginex which is in the front is just feeling a breeze

onb89336.png

Hm, isn't the output traffic suppose to be the big one here? Or I'm getting the graph wrong?

r73hpt6v.png

This is one more of the overal load this time generated by vesta instead of htop as the frist one
 
Last edited by a moderator:

tonyg

New Member
In any type of diagnosis, you have to start with the basics and work your way up the complexity ladder.

Remove all the sites except for one and start from there.
 

zzrok

New Member
What scripts are you running?  Can you see how many hits per second you are getting?  How long do pages take to load?  It appears your server is CPU bound.  Can you disable one site/application/script at a time to see which is causing the most load?  Can you see what each apache process is busy doing (http://httpd.apache.org/docs/2.2/mod/mod_status.html may be useful)?  The output of


lscpu
might be useful.
 

Greg

New Member
In any type of diagnosis, you have to start with the basics and work your way up the complexity ladder.

Remove all the sites except for one and start from there.
Those are lives sites, lots of them, and this approach would be the last thing I would do. There gotta be a smarter way to do it, right?

What scripts are you running?  Can you see how many hits per second you are getting?  How long do pages take to load?  It appears your server is CPU bound.  Can you disable one site/application/script at a time to see which is causing the most load?  Can you see what each apache process is busy doing (http://httpd.apache.org/docs/2.2/mod/mod_status.html may be useful)?  The output of


lscpu
might be useful.
Well there are lots of wordpress sites


not really sure how to see the hits?

pages load for couple of seconds

it's a VPS with 2 cores

There are like 100 sites, each with little traffic, so really don't want to go there disabling them 1 by 1 :(

I would LOVE to see what each appache thread is doing, probably will be able to see what's causing the most of the load, but have no idea how. I guess I'll have to install that mod now? :)

~# lscpu


Architecture:          x86_64


CPU op-mode(s):        32-bit, 64-bit


Byte Order:            Little Endian


CPU(s):                2


On-line CPU(s) list:   0,1


Thread(s) per core:    1


Core(s) per socket:    1


Socket(s):             2


NUMA node(s):          1


Vendor ID:             GenuineIntel


CPU family:            6


Model:                 62


Stepping:              4


CPU MHz:               2399.998


BogoMIPS:              4799.99


Virtualization:        VT-x


Hypervisor vendor:     KVM


Virtualization type:   full


L1d cache:             32K


L1i cache:             32K


L2 cache:              256K


L3 cache:              15360K


NUMA node0 CPU(s):     0,1
 

zzrok

New Member
You might find apachetop useful for answering the "what is apache busy doing" and "how many requests is it receiving" questions.

I forgot about that tool earlier.
 
Last edited by a moderator:

splitice

Just a little bit crazy...
Verified Provider
Have you looked in your logs for a Layer7 DDoS? Or a (small) Layer4 DDoS since you are using mpm-prefork.
 

devonblzx

New Member
Verified Provider
What about the switch to PHP FastCGI and run the processes as the site user?

 Assuming you have multiple users on the system, this not only is more secure (with proper permissions) but it allows you to separate php from apache load and monitor php load per user.  With loads like that, I'm assuming it isn't static content.

Step two: http://httpd.apache.org/docs/2.2/mod/mod_status.html
 
Last edited by a moderator:

Greg

New Member
What do your access and error logs look like?
Well there are 50+ sites, i clicked few at random, nothing unusual

would like to narrow down the site/sites first and then will be eay to look into the logs

Looking at your bandwidth graph - aren't you being DoS'ed?
i fixed this there was a script went crazy, the input bandwidth is now almost non-existent but the load is still there

You might find apachetop useful for answering the "what is apache busy doing" and "how many requests is it receiving" questions.

I forgot about that tool earlier.
here is the outpuf of that I can't understand anything


last hit: 00:00:00 atop runtime: 0 days, 00:03:17 19:53:57
All: 0 reqs ( 0.0/sec) 0.0B ( 0.0B/sec) 0.0B/req
2xx: 0 ( 0.0%) 3xx: 0 ( 0.0%) 4xx: 0 ( 0.0%) 5xx: 0 ( 0.0%)
R ( 30s): 0 reqs ( 0.0/sec) 0.0B ( 0.0B/sec) 0.0B/req
2xx: 0 ( 0.0%) 3xx: 0 ( 0.0%) 4xx: 0 ( 0.0%) 5xx: 0 ( 0.0%)


replace prefork with event...on debian "apt-get install apache2-mpm-event"
ok, what to do with that? Sorry not familiar with it at all

I've attached fresh load graph

(the drop in load is when mysql was crashed (not sure why) and all sites with DBs (most of them) were down)

load5.png
 
Last edited by a moderator:

DomainBop

Dormant VPSB Pathogen
ok, what to do with that? Sorry not familiar with it at all

MPM Event scales much better than Prefork and you should see a drop in both load and memory usage if you switch to it.
 
Last edited by a moderator:

Greg

New Member
ah this was the thing that changes apache to work more like nginex right?

workers vs threads or something like that if i remember correctly.

I will definitely loook into that but first woudl like to see how to pin down the site responsible for that.

How come there isn't ready tool to see which from 10s of sites makes apache most busy?
 

zzrok

New Member
There are a few tools that will give you information about what apache is doing.  Apache has mod_status, and there are a number of tools like apachetop, atop, apache-top.  Those tools either analyze the logs or use mod_status information.  You'll have to do some work to get them configured and operating correctly, but I'm quite sure they will provide the information you want.
 

SentinelTower

New Member
ah this was the thing that changes apache to work more like nginex right?

workers vs threads or something like that if i remember correctly.

I will definitely loook into that but first woudl like to see how to pin down the site responsible for that.

How come there isn't ready tool to see which from 10s of sites makes apache most busy?
I second what zzrok is stating. Enabling mod_status should tell you which site is the culprit. Use the extended status which looks like this (http://www.apache.org/server-status) and you should see the Vhost causing your CPU load.
 
Last edited by a moderator:

Greg

New Member
Ok after only 3 months I found time to try it

i'm following this tutorial http://articles.slicehost.com/2010/3/26/enabling-and-using-apache-s-mod_status-on-ubuntu

and turns out i had mod_statuts included and even enabled by default already!

However since im with nginx in front my 


/etc/apache2/sites-available/default file is empty and i'm not sure how to make it accessible then
the tutorial says to just add that to the file


<Location /server-status>
SetHandler server-status
Order deny,allow
Deny from all
Allow from localhost
</Location>

within the "VirtualHost" configuration block but I don't even have this block in the default file

so how does one enable it with nginx>apache configuration like mine?
 

Greg

New Member
Ok I set it up.

Each time I refresh the page i see some vhosts that have been used just recently

but now what?
 
Top
amuck-landowner