amuck-landowner

Observium Issues

HalfEatenPie

The Irrational One
Retired Staff
Howdy!

So it seems me screwing with my old tried and true observium installation isn't helping out with it at all.

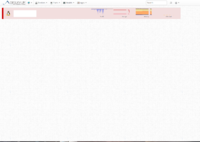
So I'm on the latest community version (0.14.4.5229) and after using it for a while suddenly my host pages are... bare. Here's a screenshot to illustrate what I mean.
h4u2DmR.png

Basically, The top bar where you have the hostname and some small graphs are shown, but everything else below it (which are usually the status and information on that specific server) aren't rendered. In addition, the bottom footer that's on all observium pages isn't shown. This issue is only shown when you click on the hostnames, it isn't present for any other pages.

I've checked the logs, there's no error logs at all about this. I don't know what's going on. I've even downloaded a fresh installation of Observium and tried it.

I've tested this out on multiple browsers (Internet Explorer, Chrome, Firefox) and all return the same result (different computers too).

It's getting weird man. Anyone have any idea?
 

fixidixi

Active Member
Hey:

1. I've never used observium but:

2. lack of error logs doesnt actually mean no erros :)

3. so if there is any sort of binary,script,etc which u can start in debug mode as a process instead of the always running daemon you should check that angle

4. I'd also check the monitored nodes if the agent running on them is actually running smooth / can establish connection etc..
 

DomainBop

Dormant VPSB Pathogen
I've even downloaded a fresh installation of Observium and tried it.
Did you try it with a fresh database too?  You could have a crashed or corrupted database table if the new install (with I'm assuming the old DB) produced the same error. 

Probably not a PHP error if the same error happened on the new install.
 

HalfEatenPie

The Irrational One
Retired Staff
Did you try it with a fresh database too?  You could have a crashed or corrupted database table if the new install (with I'm assuming the old DB) produced the same error. 

Probably not a PHP error if the same error happened on the new install.
Yeah that's what I'd figure.

I'll go back to the drawing board in a little bit and test it out with a fresh DB.  I ran the update script so I assumed it'd be fine.

If it is the database though, I'd get annoyed with data recovery mode.  
 

GIANT_CRAB

New Member
I've had experience with these kind of issues before.

  • Try checking your permissions for the rrdtool data storage's folder. 
  • Check your RRDTool installation.
  • Check your database.
  • Check your webserver's logs
  • Check your PHP's error log location (depends, check phpinfo() for the location)
I know that's a lot of things to check but that's due to the nature of your question which is quite vague (no error logs, etc). Hopefully, this has been helpful.

Thanks! :)
 

tonyg

New Member
I had a similar issue with another monitoring system.

Make sure that whatever client software you have running on the remote hosts it is configured correctly.

I'm not sure if Observium uses snmp or not but make sure any encrypted connections or working properly

The issue in my specific instance was an stunnel version incompatibility between the remote hosts and the monitoring server.
 

Serveo

Member
Verified Provider
Your poller is running correctly? We are using pro version and after a lot of troubles finally have it running smooth now.

My advice to check:

- Poller log

- Run poller from command in verbose

- Check your db

But seeing your log, this is mostlikely due to the host you are polling.
 

HalfEatenPie

The Irrational One
Retired Staff
Alright folks. This is fun *sarcasm*

I've had experience with these kind of issues before.

  • Try checking your permissions for the rrdtool data storage's folder. 
  • Check your RRDTool installation.
  • Check your database.
  • Check your webserver's logs
  • Check your PHP's error log location (depends, check phpinfo() for the location)
I know that's a lot of things to check but that's due to the nature of your question which is quite vague (no error logs, etc). Hopefully, this has been helpful.
Thanks! :)
AFAIK, Permissions for RRD is fine (hell I even reinstalled it and re-checked the permissions).

I still have to test it out with a brand new database. So this still needs to be done.

Webserver logs shows nothing out of the ordinary.

PHP Error logs is pretty bare. Observium itself is in debug mode anyways.

Yeah it's a weird problem that doesn't really seem to leave any "hint" at what's going on in the back-end. The server seems to simply "end" ending the data right after the top "summary bar" is sent. By this I mean the javascript for the dropdown menu isn't working, and even in the HTML source there's really nothing else there except for the closing tags on the DIVs.

Your poller is running correctly? We are using pro version and after a lot of troubles finally have it running smooth now.

My advice to check:

- Poller log

- Run poller from command in verbose

- Check your db

But seeing your log, this is mostlikely due to the host you are polling.
I'm 100% certain this isn't a poller issue. The smaller graphs are still showing data generated over the past time and the cron is running as per my logs. This issue isn't limited to a single host but across the board to all hosts, as in it seems the status of the host doesn't seem to factor into this issue as it's across the board (every single host, regardless of status).
 

Serveo

Member
Verified Provider
I'm 100% certain this isn't a poller issue. The smaller graphs are still showing data generated over the past time and the cron is running as per my logs. This issue isn't limited to a single host but across the board to all hosts, as in it seems the status of the host doesn't seem to factor into this issue as it's across the board (every single host, regardless of status).
What is the hosts status? Perhaps "Not polled yet"? And which OS are you running your Observium install on?

My advice would be: Spin up a new VM, do a clean install, SCP your RRD's. You will keep the data and have a clean DB to run from. If it still showing GAPS, then u'r curtain its not from your install.
 

HalfEatenPie

The Irrational One
Retired Staff
What is the hosts status? Perhaps "Not polled yet"? And which OS are you running your Observium install on?

My advice would be: Spin up a new VM, do a clean install, SCP your RRD's. You will keep the data and have a clean DB to run from. If it still showing GAPS, then u'r curtain its not from your install.
I'm not talking about the gap in the graphs haha. I'm talking about how the top "host" banner is there and rest of the content (remember, this is the "overview" page and it's supposed to look something like this: http://i.imgur.com/CKECnlz.png ). The break in the poller graphs is from me disabling the cron and working on this. Thanks for the sharp eye but not what I was talking about ;)
 

HalfEatenPie

The Irrational One
Retired Staff
I FOUND OUT WHAT THE PROBLEM WAS.

After a bit more investigation I found out the smokeping plugin has been screwing with my main Observium installation. This wasn't an instantaneous "oh I activated the smokeping plugin and everything got messed up" but something that developed after a little bit of time.

Anyways, disabling the smokeping plugin has gotten everything else to work again.

I guess I'll figure more out about it at a later time.
 
Top
amuck-landowner