amuck-landowner

UptimeTrack - Free website and server monitoring!

risharde

Member
Hi guys, I would like to introduce you to UptimeTrack, a new project I have been working on.
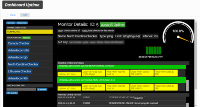

screenshot-dashboard1.jpg


This image has been resized to fit in the page. Click to enlarge.

UptimeTrack currently offers 10 free uptime monitors at 3 minute intervals. 


Why UptimeTrack?


  1. You get free monitors at lower intervals than many of the alternatives out there

  2. The platform monitoring platform is realtime. While the monitors have intervals, your dashboards are realtime.

  3. API ServerStats Sender which sends additional server information such as Memory Usage, CPU Load and Uptime to your specific monitor

  4. Public Pages example uptimetrack.com/public/?d=1

  5. Randomized uptime checks from 5 different locations and counting

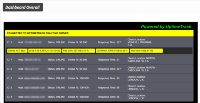
  6. An "Overall" Dashboard so your monitors can be displayed on a large screen (example: for your technicians to see it)

and more to come...


Visit http://www.uptimetrack.com to create an account, it takes about 10 seconds to get started.

screenshot-dashboardoverall1.jpg
 

TechVM

New Member
Looks nice so far. Are you able to view each server's status on the demo or is it supposed to be only showing ID 3?
 
Last edited by a moderator:

risharde

Member
Thanks TechVM, you mean via the public page? I can see more than ID 3 on the public page. Please explain so I can determine if there is a problem.


Thanks :)
 

TechVM

New Member
Thanks TechVM, you mean via the public page? I can see more than ID 3 on the public page. Please explain so I can determine if there is a problem.


Thanks :)

Correct now it only showing ID 5's stats. 


Which I means such as

uptime: 41.9 days Load: 0.40 0.24 0.26 1/351 14586 Free Mem: 458 MB (0.08 %) Used Mem: 5368.58 MB (0.92 %) Total Mem: 5826.41 MB

Is it only supposed to display a single one per visit or I am able to switch which one to see?
 

risharde

Member
Oh! Now I understand! ID:5 is a monitor which also has the serverstats sender installed on the monitored server. In other words, the server being monitored is running UptimeTrack's API ServerStats Sender which is sending additional information to the monitor using the API Key. This means that ALL monitors are capable of doing this as long as each server being monitored is also using the ServerStats Sender.


I hope this doesn't sound too confusing


Thanks for the question!
 

TechVM

New Member
Oh! Now I understand! ID:5 is a monitor which also has the serverstats sender installed on the monitored server. In other words, the server being monitored is running UptimeTrack's API ServerStats Sender which is sending additional information to the monitor using the API Key. This means that ALL monitors are capable of doing this as long as each server being monitored is also using the ServerStats Sender.


I hope this doesn't sound too confusing


Thanks for the question!

I see now! So just so I am aware.. How would I get my own servers to use the ServerStats Sender ? Does this monitor servicing works on KVM based VPSes as well as dedicated machines? Finally what does this bolded stats means..  

Load: 0.40 0.24 0.26 1/351
 

risharde

Member
Hi, all good questions! The ServerStats Sender is really just a bash script that has been compiled, there's more details when you create account with further explanation but to answer your question, the answer is yes. The script should work on any machine that uses Bash as the default CLI. All it does is polls /proc for memory, uptime and load then sleeps for 60 seconds and does it all over again. The bolded part is actually from the /proc/uptime file. I have yet to get a conclusive explanation for this, sorry - I suspect it might be process count but don't quote me on that.
 

TechVM

New Member
Thank you very much for the quick responses!  


I will definitely give it a "go" for my upcoming project given it perfect for people like us who can't afford to vend for "all the bells and whistles".  Given that I will be just starting operation up. 
 

risharde

Member
Not a problem, glad to help! :)


I'll be working on more features to come so don't worry, bells and whistles are on the way :)
 

OnACloud

New Member
Verified Provider
Looks like a great project @risharde!


I will definitely have to test it out.


Is there any notification features yet? ie. email, sms?


Thanks,


Tom
 
Last edited by a moderator:

risharde

Member
Thanks Tom, really appreciate it! For the moment, notifications are via email. I plan to work on a low resource android app so users can receive notifications via that as well. In terms of SMS, I am not sure if I am going to do that because managing premium sms is hard and probably going to be expensive. You can use an email to sms gateway and just use the email function to get notified so that might work as well. Let me know what you think? Based on the demand, I will work on notification features
 

risharde

Member
Hey guys, just an update, I've added a new dash called "Log Consolidator". It basically shows your monthly history data in such as way that you can see how long you had outages per outage. It's really simple but hard to describe so if you're already a user of UptimeTrack, just head over and have a look at it.


I'm working on CSV exporting and should be released by tomorrow evening via the Log Consolidator.


Hope you guys enjoy it!
 

OnACloud

New Member
Verified Provider
Thanks Tom, really appreciate it!

Not a problem at all :) It's always good to see new projects!!

Let me know what you think? Based on the demand, I will work on notification features

You could always try adding the ability to plugin to SMS Gateways API's. That way the user has the account with the SMS provider and you don't need to manage it at all.
I have used the following SMS providers before. smsglobal.com clicksend.com & tropo.com


All have API documentation available on their websites.


Hope this helps :)
 
  • Like
Reactions: fm7
Top
amuck-landowner