amuck-landowner

What is the Data Center Cost of 1kW of IT Capacity?

fm7

Active Member
Ponemon Institute and Emerson Network Power are pleased to present the results of an original benchmark study to determine average costs to support 1 kW of compute capacity in today’s data centers.


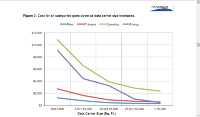
The results of this study are based on data from 41 data centers, representing 31 companies, who reported on their costs in four categories that together comprise total data center costs: Physical Plant, IT Assets, Operating Costs and Energy Costs.


These organizations also reported on data center size, IT load, number of racks and median rack density, enabling the Ponemon Institute to quantify the cost to support 1 kW of capacity for data centers in five size ranges:
• 500–5,000 sq. ft.
• 5,001–10,000 sq. ft.
• 10,001–25,000 sq. ft.
• 25,001–50,000 sq. ft.
• > 50,000 sq. ft.


XAVeG3O.png


Grc2a17.png


XQSmCwp.png


30QPa8v.png:


http://www.emersonnetworkpower.com/en-US/Resources/Market/Data-Center/Latest-Thinking/Ponemon/Documents/CosttoSupportComputeReport.pdf
 

HalfEatenPie

The Irrational One
Retired Staff
Hm interesting.  


I can't stop but see Ponemon as Pokemon.


Jokes aside, the research paper they've published focuses on simply addressing the goal/idea they want to express and I think they missed some valuable opportunities to perform a proper analysis.  I'm sure it works and makes sense for their use, but this research seems really incomplete.  Now there's no abstract so I'll simply rewrite the important parts of their research.


Disclaimer: I am a climate change adaptation and climate change impact assessment researcher.  I am published and have presented at various conferences, universities, and events.  This however does not mean that I am an expert in data center operation.  While the analytical skills are similar they are in different fields and therefore I am not fully aware of all the impacts and information required when performing an analysis on data center operations.  Therefore, please be critical thinkers and don't take my own interpretation and comments of this study as the final "end-all be-all".  Honestly I'm sure if I actually talked with the authors of this paper they'll be able to answer all of my comments and questions to a satisfactory level.  Therefore, the information below is written simply for entertainment purposes and just questions I had when I was reading this paper.  For everyone else, if I am incorrect then please feel free to let me know.  


=== Quick Review ===


Research Background


Study was over a 6 month period and was funded by Emerson Network Power.  This means limited data collection methods without disrupting normal operations.  


Data Collection


The firm collected data by sending out surveys to each data center and then a phone call to the datacenter.  They contacted 63 data centers (had their contact information from a previous study they did) and 31 organizations responded (with a total of 41 data centers).  


Methodology


Basic statistical analysis of the raw datasets and graphics generation.


Results


Charts given above.


Analysis of Finding


3 major points and 5 secondary points.  

  • Basically removing unused hardware (which will still eat up power and cooling and such) will increase operating efficiency and energy efficiency. (Basically taking power saving measures)
  • Economies of scale is a major factor. (This is a no brainer.  If you run a bigger operation the bottom line will be more expensive but the per unit basis cost will be cheaper.  This is the law of economics).
  • Variance in rack density wasn't significant enough and is considered negligible since they're focusing on data center size and range.

Conclusion


As you know, there is no actual conclusion in this paper.  In a proper research paper "Analysis of Finding" should be written as "Results" and the graphs are generated to support the findings in "Conclusion".  The conclusion is where the decision related with the research is supposed to be located.  They seem to try and use "Analysis of Finding" as a pseudo results-conclusion section of the research paper but I think a proper conclusion section would really help out with driving the key points of this paper. 


=== Quick Review ===


My Analysis


Overview


The research they published doesn't introduce anything new.  It reinforces the concept of economies of scale.  The funny thing is though, a business's decision making process should have already performed a similar study (regarding their own situation/deployment), so maybe performing an analysis on their "forecasted dataset" vs "observed dataset" would be an interesting analysis.  However, this paper right here reinforces what everyone knows: buy big, it's cheaper per unit.  


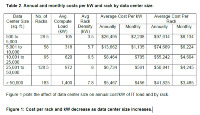
Table 2


For column 1, I think a linearly increasing scale would be important and more valuable for analysis.  Mostly since the first entry is from 500 to 5000, that's a very large variation in spacial area (that's a factor of 10 right there...).  Then the second row is a factor of 2, then it's a factor of 2.5, then a factor of 2 again, then "rest".  It doesn't seem like they broke the dataset down to make it evenly distributed either so besides for making it "look" aesthetically pleasing for the reader, I don't see why the data should be broken down in this manner.  


Column 2 should be "Average Number of Racks", not "No. of Racks".  


What interests me about this table is that the average rack density value increases as the data center size increases but then drops off when it gets bigger.  Does this mean that for a larger datacenter size people usually space their hardware out better?  Why do smaller data centers have a lower average rack density?  Most would expect them to be around similar values wouldn't they?  


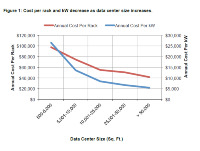
Figure 1


I'm the type of guy who hate graphs like this.  It's a line graph but the two data points they're showing on there have no real relation with each other.  Usually when you put a graph like this on you want to show that the area where they intersect has an important meaning behind it, however because the unit axises are incorrect representing data in this format should be incorrect as it just doesn't make reasonable sense to put them on one graph.  Even if they were on the same unit scale ($) it wouldn't make sense since the important information they're trying to show is that as the square footage increases the annual cost per rack and per unit of power decreases.  Just have two graphs for that. 


Figure 2


Now this shows the breakdown/distribution of what percentage of the total costs are for.  What interests me is why is the "amortized plant" value increase from 5% to 6% then back to 5% for rest of the area?  Is it because one organization they surveyed had a different policy?  I don't know just interesting.  This point really doesn't matter though. 


IT Assets and Operation.  Shouldn't this value be decreasing thanks to the rules of economies of scale?  Increased square footage would increase the number of IT assets (which if you looked across the average range is fairly even with slight variations) and the operating costs all remain the same (I'd expect them to be decreased).  Anyways this is just my comment expressing how these data points not showing the expected results I was expecting and instead remained constant as interesting and something I think should be investigated further.  However this chart (I think) expresses some major concerns.


So this is the total costs by category.  This means that the most sensitive variable (or most impactful variable) is the cost of energy.  As your DC grows from 500 to over 50,000 sq ft, energy costs becomes the larger factor to impact your bottom line. 


Figure 3


However due to the large number of racks, if you look at the "per rack basis" (aka rack density) then again, all the values will start decreasing.  However the Y axis is missing it's label and someone really needs to write "by rack density" in it.  


Figure 4


I think Figure 4 is a useless variable to graph the relationship of.  It seems this is a bigger difference on deployment over anything.  2.5 kW/rack and all the categorized fields are basically direct rips from the table above.  I think this is meaningless.  Now if there were more data points available and a chart with more data points than five were available, then I think this would be more useful.


Figure 5


Now Figure 5 is what interests me the most.  They recognize there is a big difference between colocation costs and operations vs the other industries which own datacenters or have a presence in a datacenter.  These values do not surprise me.  


Final Thoughts


The paper confirms what I was thinking before, and therefore strengthens economic arguments.  There's nothing more really to talk about though.  I think future studies should include a breakdown between each industry that uses a datacenter and maybe an analysis on the forecast/projections vs observed.  I mean as a business you usually do the research and say "is this reasonable?  Does this make sense?", do the studies, and then say "yes this is reasonable" and then you execute the plan.  So why not look into that?


You know what would also be interesting?  Maybe think of this problem in an economic level.  Using the cost of living index normalize all the values for each city/location you're living in, then perform a comparative analysis depending on each region (e.g. Midwest, East Coast, etc.).  From there, then form the analysis for the overall area.  Remember the cost of power in San Francisco does not cost the same for BHS.  While the cost of living index will not factor in for all of the impacts related to it, most analytical equations for most fields/industries do start with an energy balance concept, therefore I think it will be a good start to increasing the accuracy of your research.  Then I think it might be a more reasonable research.  I think there could be a wide variety of unknown variables which are impacting this study's results that you need to account for.  I mean 5 dollars of buying power in Florida isn't the same as 5 dollars buying power in New York now is it?  


It's an interesting paper and it can be really exciting and fun.  I think it needs more time (and funding) to get it there. 
 
Last edited by a moderator:

fm7

Active Member
IMO the text is just a "research report" (a cynic could call it Emerson's marketing piece) -- not a half-backed paper lacking authors, abstract, conclusions, references. :)


Said that I respectfully disagree that the research doesn't introduce anything new. Actually the study argues/sustain that despite economies of scale: 1) Personnel productivity plays a more important role in costs than energy conservation across all size ranges; 2) OPEX breakdown (proportion) is constant across all size ranges; 3) Rack density is important cost factor, defying hyperscalers' "space is cheap" mantra).


Excerpts:


"Amortized Plant and IT Asset costs account for just 15 to 20 percent of annual costs across all size ranges, while Energy and Operating costs account for 80 to 85 percent of annual costs. In all cases, Operating Costs, which include personnel, administrative, overhead and licensing costs, represent the largest percentage of total costs, accounting for 46 to 55 percent of total costs [across all size ranges]."


"Energy efficiency has received significant attention within the industry, yet the data suggests personnel productivity also presents an opportunity ..."


"The variance in rack density within each size range did not enable a statistical analysis of the impact of rack density within each data center size range. However, an analysis of similar cases within each category does illustrate how higher rack densities can reduce the cost to support the IT load on a kW basis ..."
 

HalfEatenPie

The Irrational One
Retired Staff
IMO the text is just a "research report" (a cynic could call it Emerson's marketing piece) -- not a half-backed paper lacking authors, abstract, conclusions, references. :)


Said that I respectfully disagree that the research doesn't introduce anything new. Actually the study argues/sustain that despite economies of scale: 1) Personnel productivity plays a more important role in costs than energy conservation across all size ranges; 2) OPEX breakdown (proportion) is constant across all size ranges; 3) Rack density is important cost factor, defying hyperscalers' "space is cheap" mantra).


Excerpts:


"Amortized Plant and IT Asset costs account for just 15 to 20 percent of annual costs across all size ranges, while Energy and Operating costs account for 80 to 85 percent of annual costs. In all cases, Operating Costs, which include personnel, administrative, overhead and licensing costs, represent the largest percentage of total costs, accounting for 46 to 55 percent of total costs [across all size ranges]."


"Energy efficiency has received significant attention within the industry, yet the data suggests personnel productivity also presents an opportunity ..."


"The variance in rack density within each size range did not enable a statistical analysis of the impact of rack density within each data center size range. However, an analysis of similar cases within each category does illustrate how higher rack densities can reduce the cost to support the IT load on a kW basis ..."

You know what.  That is true I'll give you that.  I may have misunderstood some key details then (pardon me, since I'm not an expert on this topic anyways... armchair datacenter researcher wheeee!!!!).  I guess some of my bias may have been involved in coming up with my understanding of the paper.  


Can you clarify OPEX?  Do you mean Operation Expenses?  Yeah I can tell rack density is a unit of measurement they seem to be going for (which depends on distribution of hardware inside the racks).  I'm still interested in investigating the possible energy consumption cost as scale increases, mostly since energy seem to be a bigger cost as scale goes bigger. 


Gah I can't think straight right now.  Let me get back to you about my other responses. 
 
  • Like
Reactions: fm7

fm7

Active Member
From an ancient post (2008/11):
 

Cost of Power in Large-Scale Data Centers


James T Hamilton (*)


I’m not sure how many times I’ve read or been told that power is the number one cost in a modern mega-data center, but it has been a frequent refrain. And, like many stories that get told and retold, there is an element of truth to the it. Power is absolutely the fastest growing operational costs of a high-scale service. Except for server hardware costs, power and costs functionally related to power usually do dominate.


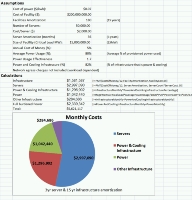
If you amortize power distribution and cooling systems infrastructure over 15 years and amortize server costs over 3 years, you can get a fair comparative picture of how server costs compare to infrastructure (power distribution and cooling). But how to compare the capital costs of server, and power and cooling infrastructure with that monthly bill for power?


The approach I took is to convert everything into a monthly charge. Amortize the power distribution and cooling infrastructure over 15 years and use a 5% per annum cost of money and compute the monthly payments. Then take the server costs and amortize them over a three year life and compute the monthly payment again using a 5% cost of money. Then compute the overall power consumption of the facility per month and compare the costs.


movFK3w.jpg


What can we learn from this model? First, we see that power costs not only don’t dominate, but are behind the cost of servers and the aggregated infrastructure costs. Server hardware costs are actually the largest. However, if we look more deeply, we see that the infrastructure is almost completely functionally dependent on power. From Belady and Manos’ article Intense Computing or In Tents Computing, we know that 82% of the overall infrastructure cost is power distribution and cooling. The power distribution costs are functionally related to power, in that you can’t consume power if you can’t get it to the servers. Similarly, the cooling costs are clearly 100% related to the power dissipated in the data center, so cooling costs are also functionally related to power as well.


We define the fully burdened cost of power to be sum of the cost of the power consumed and the cost of both the cooling and power distribution infrastructure. This number is still somewhat less than the cost of servers in this model but, with cheaper servers or more expensive power assumptions, it actually would dominate. And it’s easy to pay more for power although, very large datacenters are often located to pay less (e.g. Microsoft Columbia or Google Dalles facilities).


Since power and infrastructure costs continue to rise while the cost of servers measured in work done per $ continues to fall, it actually is correct to say that the fully burdened cost of power does, or soon will, dominate all other data center costs.


For those of you interested in playing with different assumptions, the spreadsheet is here: OverallDataCenterCostAmortization.xlsx (14.4 KB).
Jake Kaldenbaugh


November 30, 2008 at 6:44 am

Any reason why personnel costs are not included? Personnel costs can be a significant part of the ongoing costs of a datacenter as well.


James Hamilton


November 30, 2008 at 1:40 pm

[...]


Jake you asked for personal costs. The surprising then is that they are remarkably small. This is another one of those super-interesting observations. Its another one of those often repeated quotes I’ve come across like “power dominates”. Like “power dominates” the people costs dominates argument is accurate in some domains but generally not true of high-scale services. People costs dominate is often true of enterprise data centers. Server counts to admins typically run in the 100:1 to 140:1 to range. See http://www-db.cs.wisc.edu/cidr/cidr2007/slides/p41-lohman.ppt for an example of the people costs dominate argument.


People costs in the enterprise are huge. But when you are running 10^3 to 10^4 servers, you need to automate. Some of the techniques to automate well are in: http://mvdirona.com/jrh/talksAndPapers/JamesRH_Lisa.pdf. After automation, admin costs are under 10% and often well under 5% of the total cost of operation. The admin costs disappear into the noise.


See slide 5 in this deck for a quick service != enterprise argument: http://mvdirona.com/jrh/TalksAndPapers/JamesRH_Ladis2008.pdf.


I’ve seen high-scale data centers where security and hardware are under 1 person/MW. Almost free. I’ve led service that were not super-high scale and we were not close to as automated as we should be and, even then, the admin costs were only 9%.


If you want to include security, hardware admin, and software operations, a conservative estimator for a well automated, high-scale service is 10%


Thanks for your thoughts, observations, and corrections.


–jrh


Roger Weeks


December 1, 2008 at 4:03 am

I’m curious to know what the cost breakdown is between servers, storage and networking in a data center. Lumping everything into servers and other infrastructure isn’t as useful to me as at least breaking it down into the 3 major categories of equipment.


Ramki


December 1, 2008 at 8:06 am

Nice starting point. A few other things to note:


1. The per-month model forgets to account for the TIMING of the capital and expense investments.
The upfront cost of this example datacenter is 200 Million $. That’s for 1 server to 50,000 serves.
think about why the "power" seems to be such a large investment in this scenario.


2. Risk of obsolescence is not factored. No datacenter architecture can be relevant for more
than 3-5 years nowadays. Not unless you factor in a 5+ year "infrastructure recycle" cost.


3. these servers need some additional infrastructure. (eg. switches, storage, to name two). Those can
consume almost as much power as servers, combined. Is this included in the 200M datacenter cost?


James Hamilton


December 1, 2008 at 2:36 pm

Roger asked for breakdown by server, storage, and networking gear. Internet-scale service rarely use SANs and typically employ direct attached disk rather than the SANs common in enterprise deployments. The Google GFS paper gives one example of a low-cost, direct attached storage sub-system that allows them to avoid the use of SANs. The direct attached disks are costed in with the servers in the model.


I will factor out the network gear in the future and show it separately as you suggest but the quick answer is networking gear costs and power is swamped by the servers. It’s a relevant cost but small compared to the others we’re looking at. Here’s the problem. If you have 50k serves with 40 servers per rack, you end up with only 1,250 top of rack switches at around $3k to $5k each. Adding in ~250 layer 2 switches, and a similar number of layer three routers, a few aggregation routers, and a couple of border routers looks like a lot of money (it is!) but it is small when compared to the cost of the servers. Generally under 3% but I will get around to adding network gear to the model. Thanks for the suggestion.


Ramki, you brought up three points:
1. Timing of investment. You start with 1 server and grow to 50,000 over time.
That doesn’t change the argument in that regardless of how slowly you add servers, the power consumed scales with the servers and the cost of power will always be behind the cost of servers and infrastructure. Because data centers come with such a huge upfront investment, the best thing you can do fiscally is fill them as fast as possible and utilize all the resources you have had to pay for upfront. That’s hard to do and it’s why I’ve argued for modular data centers for several years now: See http://mvdirona.com/jrh/talksAndPapers/JamesRH_CIDR.doc or a more Hotnets paper: http://conferences.sigcomm.org/hotnets/2008/papers/10.pdf).
2. No datacenter architecture can be relevant for more than 3 to 5 years.
If that has been your experience Ramki, it is very unusual. Cooling towers, heat exchanges, primary cooling pumps, high voltage transformers, medium voltage transformers, high output generators, last a LOT longer than 3 to 5 years. 15 year amortization is common and quite reasonable. If you are upgrading infrastructure more frequently than every 10 years, those decisions need more review.
3. Model doesn’t include networking and storage.
The model does include storage. It’s direct attached and part of the server purchases. SANs are not common in internet-scale services and the data in the original article is why: in the enterprise, where many report that people costs dominate, SANs are a common choice or storage. In the services world, where hardware costs dominate, they are much less common due to the SAN tax being fairly noticeable at scale. We use DAS in the model and I’ve not factored the storage out separately.
It’s a good suggestion to add networking gear to the model but as I’ve argued above, networking costs although high are relatively small when compared to the costs under consideration. But I agree I should add networking to the model. Thanks,


–jrh


Andy Lawrence


December 2, 2008 at 10:29 am

An excellent analysis…thanks.


I think the origin of the "Power is the biggest cost" statement is a paper by Microsoft’s own Christian Belady, although he may have working for HP at the time (?). This paper has been widely referenced by analysts, including myself, and by the EPA in its report on datacenters. It would be interesting to compare the assumptions behind the models.


Belady, Christian L. 2007. In the Data Center, Power and Cooling Costs More Than the IT Equipment it Supports. Electronics Cooling. vol. 13, no. 1. http://electronics11
cooling.com/articles/2007/feb/a3/.comScore Networks. 2007.com


James Hamilton


December 2, 2008 at 1:07 pm

Thanks for the pointer to Christian’s article Andy. It’s excellent. Christian is one of the best.


In the article Belady says power + cooling costs more than the servers and we’re pretty close to agreement on that. If you adjust the PUE assumption to something in the high 2’s which unfortunately is not unheard of, infrastructure does cost more than servers. And, given that that work done/$ is improving constantly but infrastructure costs are flat to rising, we expect to see infrastructure eventually dominate everywhere. This was an observation made by Ken Church a year or so ago and let to Ken and I writing: Diseconomies of scale (http://perspectives.mvdirona.com/2008/04/06/DiseconomiesOfScale.aspx).


–jrh


(*) About the Author: James is VP and Distinguished Engineer at Amazon Web Services where he focuses on infrastructure efficiency, reliability, and scaling. Prior to AWS, James held leadership roles on several high-scale products and services including Windows Live, Exchange Hosted Services, Microsoft SQL Server, and IBM DB2. He loves all things services related and is interested in optimizing all components from data center power and cooling infrastructure, through server design, networking systems, and the distributed software systems they host
 
Last edited by a moderator:
Top
amuck-landowner